| H is the same
for HSV and HSL. We won't give the equations here; you can find them in
efg's
HSV lab report. Expressed in degrees (0-360º) for any nonzero
x,
H = 0 for Red (x,0,0); 60º for Yellow (x,x,0),
120º for Green (0,x,0) (illustrated below), 180º for Cyan
(0,x,x), 240º for Blue (0,0,x), and 300º
for Magenta (x,0,x). H can also be represented on a scale
of 0 to 1.
Assume R, G, and B can have
values between 0 and 1. Let W = min(R,G,B) = the gray component.
|
HSV (HSB)
|
HSL (HLS)
|
|
V = max(R,G,B)
|
L = (V+W)/2
|
|
SHSV = (V-W)
/ V
|
SHSL = (V-W)
/ (V+W) = (V-W) / (2L) ; L <= 0.5
SHSL = (V-W)
/ (2-V-W) = (V-W) / (2-2L) ; L > 0.5
|
Any color with R, G,
or B = 1 has V = 1.
Maximum saturation occurs
when W = 0.
|
A bright, fully saturated
color (max(R,G,B) = V = 1; min(R,G,B) = W = 0; SHSV = SHSL
= 1) must have L = 0.5. L = 1 corresponds to pure white.
|
|
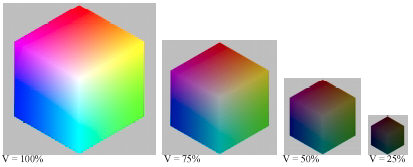
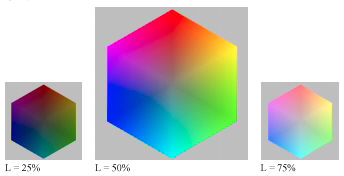
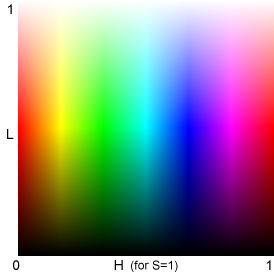
V,
L, and S illustrated for H = 0.333 (120º; Green)
|
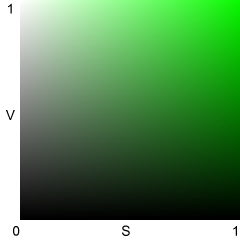
HSV: Best representation
of saturation
|
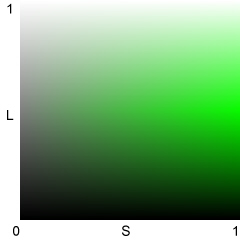
HSL: Best representation
of lightness
|
|
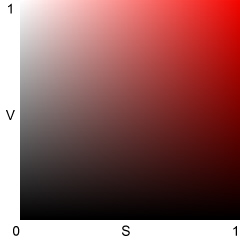
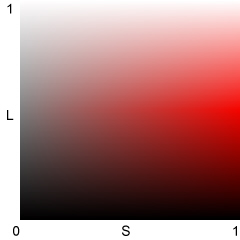
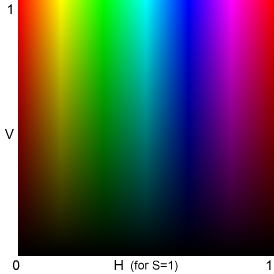
V,
L, and H illustrated for S = 1 (maximum saturation)
|
|
|
|
The Y, C, and M bands
are much narrower than the R, G, and B bands. I'm not sure why; I suspect
it results from specific properties of HSL and HSV (where V = max(R,G,B)
rather than, say, mean(R,G,B).). Y, C, and M appear brighter than R, G,
and B at similar V and L levels because both V and L are related to max(R,G,B).
|
Some
interesting relationships
(1) For W = min(R,G,B) =
0 (no gray; maximum saturation), SHSL = SHSV
= 1 ; L = V / 2 ; L <= 0.5.
(2) For V = max(R,G,B) =
1 and SHSL = 1, L = 1-(SHSV / 2) ; SHSV
=
(1-L) / 2; L >= 0.5
|
|
These relationships
imply that (1) the bottom half of the HSL L-H plot for S=1 (above, right)
is identical to the HSV V-H plot for S=1 (above, left), and (2) the top
half of the HSL S-H plot is identical to an HSV S-H plot for V=1 (not shown),
i.e., the HSL L-H plot (above, right) combines two HSV plots.
|
All saturation equations
have V-W in the numerator; they differ in denominator scaling. In both
representations, S is a measure of relative saturation. S is 0 when
W = V (R = G = B; neutral gray); S = 1 when W is at its minimum allowable
value for a given value of V or L. For HSV, W = 0 when S = 1.
For HSL with L <= 0.5,
maximum saturation takes place when W = 0; SHSL = (V-W) / (V+W)
= 1. When L > 0.5, W must be greater than 0. Maximum saturation takes place
when W = 2L-V takes its minimum value, Wmin. In this case
V = 1, so Wmin = 2L-1. SHSL = (V-W) / (2-V-W) = (1-2L+1)
/ (2-1-2L+1) = 1.
V and L don't correspond
with perceived luminance; for example, blue and gray or white with the
same V or L values would have very different luminance. The PAL luminance
signal, Y = 0.30R + 0.59G + 0.11B, corresponds more closely to perceived
luminance. |

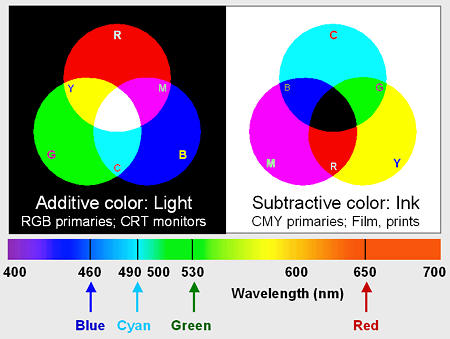 The
human eye is sensitive to electromagnetic radiation with wavelengths between
about 380 and 700 nanometers. This radiation is known as light.
The visible spectrum is illustrated on the right. The eye has three classes
of color-sensitive light receptors called cones,
which respond roughly to red, blue and green light (around 650, 530 and
460 nm, respectively). A range of colors can be reproduced by one of two
complimentary approaches:
The
human eye is sensitive to electromagnetic radiation with wavelengths between
about 380 and 700 nanometers. This radiation is known as light.
The visible spectrum is illustrated on the right. The eye has three classes
of color-sensitive light receptors called cones,
which respond roughly to red, blue and green light (around 650, 530 and
460 nm, respectively). A range of colors can be reproduced by one of two
complimentary approaches: