A
simplified Zone system for making good exposures
by
Norman
Koren
Modified May 26, 2010
This
page presents a simplified version of Ansel Adams' Zone system,
suitable
for 35mm and medium format photography, color or black & white.
The bulk
of the page was written when film was
dominant. It was
revised in October, 2005 to include material on digital photography. Digital
is different. See Tonal
quality and dynamic range in digital cameras for additional
advice
on
exposure
for digital cameras.
Polish
language version
|
Correct monitor calibration |
| is
vital for viewing and making fine prints. Two key parameters, Black
level
(often labelled Brightness)
and Contrast,
are set on the monitor. A third, Gamma,
is set in the video card lookup table (LUT). Contrast is normally set
to
maximum. Color temperature should be set to 6500K or lower— 6500K
looks
best on most CRTs. It can be set on the monitor (preferably) or with
the
video card/color management software, but not both.
Color
quality should be set to 24 or 32 bits. The room should be dimly lit;
no
direct light should shine on the screen. Gray images should look
subjectively
gray to your eye.
For flat screen (LCD) monitors, Screen resolution (right-click on the
wallpaper, Properties, Settings) should be set to the monitor's native
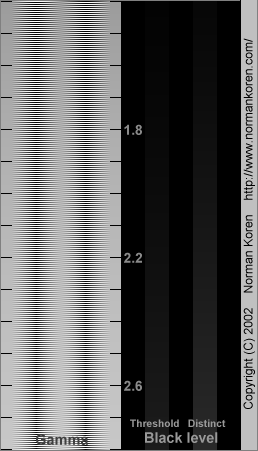
resolution. Gamma
defines the curve that relates the pixel levels in your computer to the
luminance (brightness) of your monitor and prints, using the equation,
Luminance
= (pixel level/255)gamma + black level
You can
estimate gamma from the pattern on the left side of the chart on the
right
by viewing it from a distance and observing where the average luminance
across the pattern is constant. Gamma should be set to 1.8 for older Macintosh
systems (2.2 seems to be the current standard) or 2.2 for Windows
systems
and the Internet sRGB color space using
techniques
in Monitor
calibration:
Setting gamma. Gamma is extremely sensitive to
viewing angle in
most Laptop LCD screens.This chart is only for monitors; it doesn't
work
on printed media. You
can set your monitor's Black level
using the mostly black pattern on the right of the chart. This pattern
contains two dark gray vertical bars which increase in luminance with
increasing
gamma. (If you can't see them, your black level is way
low.)
The
left bar should be just above the threshold of visibility opposite your
chosen gamma— it should be invisible where gamma is lower by
about 0.3.
The right bar should be distinctly visible, but still very dark. Black
level interacts with gamma; you may have to go back and forth two or
three
times. The
pattern provides a good indicator of display quality. Cheap LCDs can't
achieve a constant neutral gray appearance. But good flat screen
displays
can be excellent. For
more detail and a larger chart, see Monitor
calibration: Gamma and black level.
| |
|  |
| I
encourage you to load this chart on your computer and check it
occasionally.I'll
be happy to grant permission to reproduce it on your website if you e-mail
me, give me credit and a link to this page. |
If you are new to
photography and still unclear
on the basic
concepts
of exposure, Accurate
Exposure with Your Meter from Eastman Kodak is a good
introduction.
Slides,
negatives, and digital
Back
in the days when film ruled, most professional professionals worked
with color slides instead of negatives because
clients demanded them. Why? WYSIWYG! What you saw was what you got; it
was
easy
to judge the quality of slides, and when they were good, they were
really
beautiful.
Projected slides can reproduce a brightness range of 1000:1 (a
logarithmic
density range of 3); the best you can do with a print is about 100:1.
It's
difficult to judge anything from a negative; prints from camera shops
or
drug stores seldom do justice to the information on negatives.
Why then would a serious photographer choose to work with
negatives?
Because negatives can capture a much larger exposure range than slides.
(See What exposure range can film
capture?,
below.)
You can make excellent images in difficult lighting that would defeat
slide
film. Modern negative films are as sharp as slide films of comparable
speed
(possibly sharper),
though not as fine-grained. With affordable scanners,
image
editing programs and color
printers, you can produce inexpensive prints of
impressive
quality— often better than custom darkroom prints, especially
when difficult manipulations (dodging, burning, selective color shifts,
etc.) are required. Scanners work well with properly exposed
slides
of low to moderate contrast, but if you work in the field with
difficult
or contrasty lighting, negatives have an edge. And difficult lighting
can sometimes produce the finest, most dramatic images.
Since
this article was first published, digital has overtaken 35mm and
medium format film, though it still can't equal large format
for
detail. Digital SLRs (which have pixel sizes of at least 5
microns; larger than compact digital
cameras) have impressive dynamic ranges: 10 or
more f-stops, comparable to negatives and far better than slides. But
as we shall see, digital images need to be exposed more like
slides than negatives to avoid losing highlight detail. "Expose for the
shadows" applies only to negative film (color or B&W); not to
digital.
Introduction
to the Zone system
The
first thing you need to know is that exposure meters are dumb, really
dumb. They are clueless about what they're photographing. They assume
that
all scenes have the same average tonal value— middle
gray— roughly zone
5 in the chart below. If a scene is different, for example a snow
scene,
it will be exposed incorrectly. It will come out middle gray—
underexposed.
If you follow the meter's reading, every scene will
have the
same
average middle gray density. You'll get lots of bad exposures,
especially
if you photograph in difficult light.
| An
exception to the dumb exposure meter rule can
be found in
modern
single lens reflex cameras with matrix
metering, which tend to be expensive high-end models. A good
example
is the Nikon F100,
which has a 10 segment meter. It meters each segment individually, then
uses a computer program to determine the optimum exposure. The program
employs artificial intelligence or fuzzy logic— it's been
taught to
respond
correctly to a wide variety of scenes. Of course there will always be
exceptions—
a reader's comment in the photo.net
review of the F100 indicates that it can be fooled by
backlighting,
but it can be trusted most of the time. |
Ansel
Adams
developed the Zone system to cope with this situation (see history,
at the bottom of the page). His technique was to carefully study a
scene,
visualize the final print, then determine the correspondence between
portions
of the scene and tones in the print. He would then meter, expose and
develop
the negative accordingly. His basic rule was,
"Expose
for the shadows; develop for the highlights."
(Warning:
This rule applies only to negative film. It does NOT apply to slides or
digital images; more later.)
.
| Adams
used a view camera and developed each sheet
film
negative individually, based on the scene contrast and the
previsualized
print tonalities. The greater the contrast in relation to the print,
the
shorter the development time. His system is very elegant— it
produces
prints of exceptional tonality, and most images print on a single grade
of paper (Adams preferred grade 2), but it requires a tremendous amount
of testing, calibration, record keeping, and time. It's not practical
unless
you have access to a darkroom and plenty of time. We present
a simplified Zone system that will enable you to
make excellent
exposures. The technique is identical for color and black and white
negatives,
but different for slides and digital, where it can be used to
find a
starting
point for bracketing (for critical work). Once you get the hang of it,
you'll find it's not all that complex. | |
| The
difference between the "simplified" and full Zone system |
| is that in the simplified Zone
system you don't
have control over development;
you control only the exposure. You give up the idea of making most of
your
prints on a single grade of paper. This is no problem if you plan to scan
your film and print digitally because you have total control
over
print
contrast. The goal of the simplified Zone system is to expose film for
optimum image quality— to make sure all the critical
information is
present. | |
|
Zones
Tones
in scenes and prints are divided into nine zones, numbered 1
through
9 from dark to light. Zone 5 is, by definition, subjective
middle
gray.
In a scene—
in the field—
each zone represents a doubling or halving of the luminance—
the light
reflected from the subject— or equivalently, a difference of
one
f-stop.
The 8 steps between the nine zones represent a luminance range of 256 (28),
typical for landscapes on sunny days and
somewhat less than
negative film can capture.
The actual
tonal range of scenes can, of course, be very different.
In
a print, zone 1 is
pure
black, zone 9 is pure white, and zone 5 is subjective middle gray,
corresponding
to a reflectance of about 18%. On good photographic paper, pure white
is
a little over 90% reflectance and pure black is about 1 – 2%
reflectance.
The
maximum luminance range is around 50 to 100, equivalent to
about 6 zones;
a good deal less than the 8 hypothetical zones in the original scene.
Since
the difference between subjective middle gray (18% reflectance) and
white
(a little over 90%) is a factor of 5, equivalent to only 2.3 f-stops,
highlight
tones in a print tend to be compressed with respect to tones in a
scene.
A zone chart printed on paper therefore involves a degree of
compromise involving the application of an "S" curve.
The charts below are derived from an equation
intended to make zone
5 on a properly
calibrated
monitor
appear as subjective middle gray— about 21% of the maximum
screen
brightness
level, similar to middle gray on a print (18% reflectance referenced to
90% white). The equation is in a box
near the
end of the page. It may interest math geeks, but it is
unnecessary
for understanding
the Zone system. The charts for gamma = 2.2 and 1.8 came out closer
than
I expected. The major differences are in the lower zones. The zones
below
closely resemble those in my 1959 edition of Ansel Adams' "The
Negative."
[A piece of irresistable trivia: Adams
received exactly ten
cents royalty for each copy of the book.] On a
properly calibrated
monitor
the zones here are more accurate than those in the book.
|
|
|
Zone system chart
for gamma =
2.2 (PC's,
sRGB color space)> |
|
|
|
Zone system chart
for gamma =
1.8 (Macintosh) |
| Note
1. To
display these
tables correctly in Netscape, the Always
use
my colors, overriding document box must
be unchecked. Click Edit,
Preferences, Appearance, Colors) In
Firefox, click Tools,
Options,
General,
Fonts &
Colors. To
print
in Internet Explorer 5, Click on Tools,
Internet
Options..., Advanced.
Scroll
down and check the box, "Print
background
colors and images." You might want to uncheck it
afterwards. |
| Note
2. The best
way to
print these charts, which are HTML tables, not
image
files,
is the following. (1) Adjust the width of the window for
proportions
you like. (2) Copy the window into the clipboard by pressing
Ctrl-PrintScreen
on your keyboard. (3) Paste the image into your image editor. (4) Crop
it and otherwise adjust it in the editor. (5) Print it from
the
editor. |
You will need to have a good
feeling for zone 5—
middle gray, so if
you don't entirely trust your monitor— if zone 5 doesn't
correspond to
your idea of middle gray— go to a camera store and
buy a Kodak
18%
reflectance gray card. These cards are used by professionals for
exposure
metering in the studio: They place the card next to the subject and
meter
from it. This is equivalent to incident
light
metering: measuring the light that reaches the subject. With incident
metering,
the exposure is independent of the subject's reflectance: dark subjects
come out dark and light subjects come out light. Incident metering
works
very well in studio environments and for close-ups, but it usually
isn't
practical for landscapes— the light at the photographer's
position must
be the same as the light on the subject. Incident
metering produces excellent results when it can be
used.
Meters built into cameras measure reflected light.
Ansel
Adams' description of zones (geared towards black and white printing)
Low
values
Zone 0 | Complete lack of density in the
negative image, other
than film base density plus fog. Total black in the print. We
will omit zone 0 from the remainder of this tutorial; zone 1 will be
considered
pure black. Omitting zone 0 makes little practical difference. |
| Zone 1 | Effective threshold. First step above
complete black
in the print. Slight tonality, but no texture. |
| Zone
2 | First
suggestion of texture. Deep
tonalities, representing
the darkest part of the image in which some detail is required. |
| Zone 3 | Average dark materials. Low values
showing adequate
texture. | Middle
values
Zone 4 | Average dark foliage. Dark stone.
Landscape shadow.
Recommended shadow value for portraits in sunlight. |
| Zone 5 | Clear north sky (panchromatic
rendering). Dark skin.
Gray stone. Average weathered wood. Middle gray (18% reflectance). |
| Zone 6 | Average Caucasian skin value. Light
stone. Shadows
in snow in sunlit snowscapes. | High
values
Zone 7 | Very light skin. Light gray objects.
Average snow
with acute side lighting. | | Zone
8 | Whites
with textures and delicate
values (not blank
whites). Snow in full shade. Highlights on Caucasian skin. |
| Zone 9 | Glaring white surfaces. Snow in flat
sunlight. White
without texture. (The only subjects higher than Zone 9 would be light
sources;
they would be rendered as the maximum white value of the paper surface.) |
|
Good
exposure
Negatives—
You
probably know what a well exposed slide looks like— it's
pretty
obvious.
Colors are rich and saturated where you expect them to be, and no
important
areas are washed out or too dark. But it's less obvious what makes a
well
exposed negative. First, there should be detail in all important shadow
areas. In underexposed negatives, shadow areas look clear—
detail is absent;
there is nothing to print. Information is lost. Shadow detail is
extremely
important in tonally rich, satisfying fine prints. But shadow areas
shouldn't
be too dense. If no areas of the negative approach the film base
density;
if the entire negative is thick, it's probably overexposed. This
isn't necessarily disastrous. Negative film can capture a huge tonal
range,
and the detail you need to print is probably still present. But if you
overexposed, you either used a longer shutter speed than necessary
(more
chance of camera shake or blur) or a wider aperture (less depth of
field
and possibly less lens sharpness; in 35mm cameras, lenses are sharpest
between around f/5.6 and f/11). Portions of the
negative may be denser than the Dmax of the scanner (the highest
density
it can respond to, typically 3 to 4 on a logarithmic scale). In black
and
white film, dense areas of negatives become grainy and lose sharpness;
color negative film isn't quite as bad. Nevertheless, image quality is
often degraded in overexposed negatives.
Slides—
The situation is reversed is slides, where
overexposure is the
cardinal sin. Overexposed areas are washed out and lacking in detail.
Slides
capture a much smaller brightness range than negatives, hence they
require
very careful exposure. Some detail may be lost in contrasty scenes,
even
in well-exposed slides. Most professionals
bracket their slide exposures:
expose at nominal, ± 1/2 f-stop, ± 1 f-stop, and
sometimes
more. They wouldn't think of risking a $1000 job to save $20 of film.
In
landscapes, where the sky and scenery at the top of the frame is often
much brighter than at the bottom, a graduated neutral density filter
(dark
on top; clear on bottom) can be invaluable for reducing the brightness
range. These filters come in several gradients and maximum densities.
It
takes practice to use them effectively.
Digital—
As with slides, overexposure
resulting in blocked highlights is the most common problem. Digital
sensors are linear, and like all
linear devices, they have an abrupt cutoff. According to Kodak
Image Sensors – ISO Measurement, when a digital
sensor is exposed for an 18% reflectance gray card, 106% reflectance
will saturate (reach pixel level 255 out of 255). This can result in
blocked highlights in contrasty scenes. Many digital cameras have tonal
response "S" curves that reduce the severity of the blocking. These
curves are applied when the RAW files are converted. Even so, digital
photographers must be ever vigilant; they must pay attention to
highlights when setting exposure.
Capture RAW images whenever
the lighting is challenging and you want the best image quality.
Converting RAW files to standard formats on a computer (off the
camera), gives you tremendous control over the results. You can correct
color, adjust contrast, and apply tonal response curves. You can also
convert to 48-bit color, which allows you to do extensive manipulation
(dodging, burning, etc.) without degrading the image or causing
"banding." For more details, see
Tonal
quality and dynamic range in digital cameras.
|
A beginner's glossary of confusing photographic terms |
Shutter
speed is the amount of
time the shutter is open
during
exposure. It is the inverse of the number on the dial. The standard
sequence
is 1, 2, 4, 8, 15, 30, 60, 125, 250, 1000, ..., where 125 represents
1/125
second, etc.
Aperture
is the variable opening in the lens that admits light.
F-stop
is a measure of the aperture opening, defined as a lens's focal length
divided by the aperture diameter. F-stops are sequenced in multiples of
the square root of two: 1, 1.4, 2, 2.8, 4, 5.6, 8, 11, 16, 22, etc.
Increasing
the f-stop by one step halves the light reaching
the film. F-stop
also refers to a change in the aperture by one
step, which
doubles
or halves the light reaching the film. "Opening up" or "increasing" the
aperture means admitting more light; reducing the
f-stop.
Similarly,
"stopping down" means admitting less light; increasing
the
f-stop.
The speed of a lens is its maximum aperture, i.e.,
smallest
f-stop.
Film
speed
is a measure of a film's sensitivity to light. Faster films tend to
have
more grain and less resolving power.
Exposure
is the total light reaching the film. It is a function of the luminance
of the subject (the light it emits), the aperture setting, the shutter
speed and the film speed. Photographers often say, "increase the
exposure
by one f-stop," or "stop down by two f-stops." They don't literally
mean
change the aperture. They mean adjust either the
shutter speed
or
the aperture. We will use this terminology below. |
|
The
heart of the matter: determining exposure
The
key to the Zone system is visualizing how you want areas of the
scene
to appear in the final image, or in the language of the Zone system,
where
you want to "place" them. The Zone system can then be expressed in a
single
statement: Select
an area of the scene, meter it, then adjust the exposure by the
difference
between the zone you want in the final image and zone 5 (middle gray).
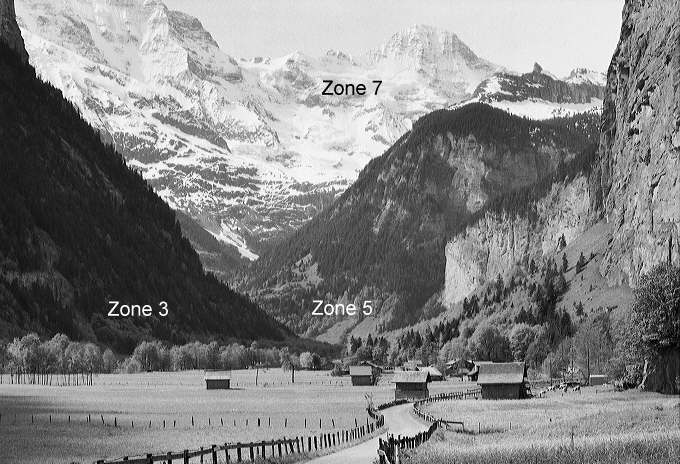
For example, suppose you want to place the snowy
mountains in scene below
(Lauterbrunnen,
Switzerland, with the Jungfrau range in the background) at zone 7.
Meter
them, then increase the exposure by two f-stops,
i.e., if the
meter
says 500 at f/16, expose at 250 at f/11. Or if you choose to place the
shaded mountain on the left at zone 3, meter it, then decrease
the
exposure by two f-stops. I probably pointed the camera, a Canon FTb
with
a narrow angle meter, down slightly towards the Zone 5 region, then
exposed
as indicated. It's that simple. Of course the devil is in the details.
And there are several.
| The
first devilish
detail is that
you must be aware of your meter's sensitivity pattern. The Zone system
was designed for narrow angle meters, such as 1o
spot meters
(see sidebar). Typical SLR's have center-weighted meters, whose
sensitivity
is greatest near, or slightly below, the frame center (below to respond
less to bright skies in horizontally oriented landscapes), falling off
gradually towards the edge. These meters are not designed for the Zone
system and must be used with care. You have to average over the region
of sensitivity. If you're shopping for a new camera, look for one with
a narrow angle metering mode. The second
devilish detail is
how to determine the region to
meter.
For negatives you should bias your choice towards shadow
regions— light
shadows, not deep ones. The Zone 3 mountain on the left is a good
example.
But it's OK to take shortcuts. If a scene is not too contrasty, it's
safe
to meter from middle tones; shadow detail will be maintained. If it's
very
contrasty, try to meter off a shadow area. If your meter's sensitivity
pattern doesn't allow you to isolate shadows, consider opening up one
or
two f-stops or bracketing, i.e., making several exposures: nominal, one
stop over, etc. You'll learn from experience. For
slides and digital, where overexposure must be avoided, you should
bias your
choice towards middle to lighter regions, with emphasis on the most
important
part of the image. For slides, you may want to take several
zone-adjusted readings
and use them as the basis of bracketing. For digital, you can make a
test exposure, then look at the histogram to be sure highlights are not
blocking. The
third devilish detail is how to actually set the
exposure.
If you
have an old-fashioned camera with manual f-stops and shutter speeds, or
an automatic camera with full manual override, you have no problem. If
you have a automatic camera that allows exposure compensation, go ahead
and use it, but be forewarned— be mindful! It's easy to
forget that
you've
compensating, and your camera won't remind you. My neighbor lost most
of
the images from a trip to the Canadian Rockies because he forgot to
turn
off an exposure compensation mode in his ultra-sophisticated Canon EOS
3. (He now has a Canon digital SLR; no more problems.) The
final detail, not so
devilish, is that you
must carefully
examine
each negative or slide when you get it back from the processor. A lightbox
and loupe can help with the evaluation. (Digital is ever so
much easier; you can examine the histogram in the camera, immediately
after the exposure.) Remember that films,
shutters,
apertures, and meters all vary, and they can change with time. The film
speed on the box isn't absolute; it's only a suggestion. If your
negatives
or slides are consistently underexposed, decrease your camera's film
speed
setting. Conversely, if they are overexposed, increase the setting.
Don't
bother trying to figure out exposure from prints. They're entirely
misleading
because most photo labs use programs to expose them, and the density of
the print is unrelated to the negative. Underexposed negatives result
in
washed out gray shadow areas that beginners often misinterpret as
overexposure.
As we engineers say, you must "close the loop," that is, keep adjusting
your technique based on recent results. If you do, you'll be rewarded
with
beautifully exposed negatives and slides nearly every time. |
|
| In
Ansel Adams' full Zone system, you
would expose to
maintain
shadow detail, then develop to place highlights in zones of your
choosing.
For example, in the scene above you would meter the shaded mountain
mountain
on the left and expose for zone 3— two f-stops below the
meter's
reading.
You would then meter the highlight area— the sunlit snowy
mountain.
Assume
you chose to place it at zone 7, 4 zones above the shadow area. If it
metered
4 zones higher, you would give it a "normal" (N) development. If the
scene
were contrasty and metered 6 zones higher, you would give it "normal
minus
2" (N-2; shorter) development. Similarly, if it were a flat scene and
metered
only 2 zones higher you would give it (N+2; longer) development. By
using
this technique, Ansel Adams could make most of his prints on a single
grade
of paper with beautiful tonalities. The process of determining
development
times is beyond the scope of this article (it takes a lot of work);
I've
included this brief description to clarify the difference between the
simplified
and full Zone systems. I'll offer one tip for those of you
who do black and
white darkroom
work. Adams targeted his development times to print on grade 2 paper.
When
I was doing 35mm and medium format darkroom work, I found that
targeting
development times so an average scene would print on grade 3 (higher
contrast)
paper resulted in better image quality. The dense areas of negatives
optimized
to print on grade 2 paper can get noticeably grainy in small film
formats.
This is not an issue with 4x5 and larger formats. |
| Spot
meters
are reflected light meters with narrow sensitivity angles, from 10o
to 1o for classic models. They are the most
accurate way to
implement the Zne system. Without one you have to compromise, but with
practice (know your meter's sensitivity pattern well!) you should be
able
to make good exposures most of the time, and know when to bracket
(contrasty
situations). If you don't want to use an external spot meter
with
your 35mm camera
(I don't), the next best thing is a manual exposure camera with
match-needle
spot metering. The Canon FTb and F-1 (both old and "new" models) meter
a rectangular area covering 12% of the frame— close to ideal
for the Zone
system. The "New" F-1 is my favorite; its modern meter responds
quickly,
even in dim light. The FTb and older F-1 have slower CdS meters that
work
well in most situations. They can be purchased used at reasonable
prices.
An important tip: the PX625/PX13 mercury battery is no longer available
(turns into incredibly toxic waste when thrown out). The MR-9
battery adaptor from CRIS
Camera Services in Phoenix (800-216-7579) allows you replace
it
with
the widely available Silver 76 battery. |
|
 |
| If you enjoy working with the Zone system, you should check out LightZone, a new image editor based on Zone system concepts. LightZone has a built-in raw convertor and a highly intuitive interface, You may never need to open Photoshop again. |
|
Simplified Zone system summary |
- Know
your camera's
metering pattern.
-
Select
a portion
of the scene to meter.
Shadow areas
are
generally preferred for negatives and middle to highlight areas for
slides and digital,
but the most important part of the scene is often the best choice.
You'll
learn from experience.
-
Decide
the zone in the
final image to place
this portion of the scene. (For example, you may want to place dark
foliage
at zone 4 or snowy mountains at zone 7.)
- Meter
the selected
portion.
- Determine
the exposure.
Adjust the meter's exposure by the difference between your
chosen
placement
and zone 5.
For example, to place
a region on zone 7, increase the exposure by 2 f-stops over the meter
reading. For slides or digital cameras, highlight areas where detail is
to be maintained should be placed no higher than zone 7.
- Practice.
Examine the exposure of your slides or negatives (but not the prints).
Learn to interpret the histogram on your digital camera. Keep
refining your technique and calibrating your equipment.
|
|
Zones
and colors
Bright
colors can confuse your estimates of zone values. It's easy to
pick
out a middle gray and say, "that's zone 5." But what arout red (seems
to
be in the middle)? Yellow (seems brighter)? Blue (seems darker)? To
clarify
the effect of colors on zone estimates, I printed out the following
chart
on Epson Matte Heavyweight paper and measured each square's
reflectivity
on an overcast day with my Canon "new" F-1.
| Z
1 | Z
3 | Z
5 | Z
5 | Z
7 | Z
9 |
| | |
|
|
|
|
| R |
Y |
G |
C |
B |
M |
| | |
|
|
|
|
|
The top row contains zones 1,
3, 5, 7 and 9. Tonal values are
compressed
in the monitor display and print. (The tonal range is 5, rather than 8,
zones.). The second row contains dark colors, the third contains pure
primaries
(R,Y,G,C,B,M), and the fourth contains pastels. HTML color names are
shown
in brackets [...]. In some cases they differ from conventional names. This
chart is fairly simple to use. If you are metering off a
surface
that subjectively resembles one of the colors, make the exposure
adjustment
(relative zone 5) shown on the right. For example, if you are metering
off a pure yellow surface, increase the exposure by 1.5
f-stops
above
the meter reading (zone 5), i.e., place it at zone 6.5. The
values
on the chart are accurate to about +/-0.25. |
|
Zone
1
-2.5 |
Zone
3
-1.5 |
Zone 5
0 |
Zone
7
+1.5 |
Zone
9
+2.5 |
[Maroon]
-1 |
[Olive]
0 |
Dark
green
[Green]
-0.5 |
[Teal]
0 |
[Navy]
-1.5 |
[Purple]
-1 |
[Red]
+0 |
[Yellow]
+1.5 |
Green
[Lime]
+0.5 |
Cyan
[Aqua]
+1.5 |
[Blue]
-0.5 |
Magenta
[Fuscia]
+0.5 |
| +1 | +2 |
+1.5 |
+2 | +0.5 |
+1 |
|
|
To download the
above chart for printing, shift-click here.
Use the chart for a rough estimate of how to meter
off bright colors
in the field. Note that the subtractive primaries (Y, C, M) are lighter
than the additive primaries (R = Y + M; G = Y + C; B = C + M). Green as
we perceive it in nature (typical leaves and grass) is generally darker
than spectrally pure green (early spring foliage). Blue as we perceive
it in nature (except for rare deep blue skies in mountains above 3,000
meters) is generally lighter (and closer to cyan) than spectrally pure
blue— much
lighter
for typical "blue" skies.
Imatest
The Imatest
program, written by this author (it's kept him busy since 2003),
provides a staightforward means of calculating digital camera response
curves (log10(pixel level) vs. log10(exposure)), which are comparable to the film and paper response curves shown below.
Imatest can also calculate a camera's dynamic range, either from a
single image of a transmission step chart or multiple images of
reflective step charts, which typically have lower density ranges
than transmission charts. For more detail, refer to the following
links: Using Stepchart (especially the Dynamic range section), and Dynamic Range
(a postprocessor for Stepchart). Here is an example of Dynamic Range
results for the Canon EOS-20D. The DR numbers are based on the
signal-to-noise ratio. Imatest Studio, which measures a
wide variety of image quality factors, is available to individual
photographers at a very attractive price.

Imatest Dynamic Range results
Links
Beyond the Digital Zone System— by Russell Cottrell An exploration of the dynamic range of his digital camera.
A
Simplified Zone system... (this article) translated into
Polish by
Radek Przybyl. (I'm "Normana Korena" in Polish!)
Accurate
Exposure with Your Meter from Eastman Kodak. A good
introduction
to the basics of exposure.
Zone2Tone
(Tech notes)
Les Meehan's images and introduction to the Zone system. Excellent for
exploring the subject in greater depth.
The
Zone System
by Steve Roberts of SR Photography. A nice introduction.
The
Zone System
by Lars Kjellberg. Fine work from creator of the website with the best
lens
reviews.
Exposure
correction
by Klauss Schroiff. A simple explanation of exposure without zones.
The Zone
system
by Cicada Photography Resource. Very detailed. Probably more than you
want
to know.
Books
on the Zone system.
Curvemeister,
written
by Mike Russell, is an interesting curves adjustment plugin for
Photoshop—
something like the Picture Window Pro curves adjustment with zones
added.
I haven't tried it.
|
What exposure range can film capture? |
| This
is the characteristic curve
for Ektachrome
100VS slide film— Kodak's answer to
Fuji's highly saturated Velvia.
E100VS responds to Log Exposures between -2.0 and -0.3:
a range of about 1.7 on the log scale or 101.7 =
50 = 5.6
f-stops (or EV or zones). | |
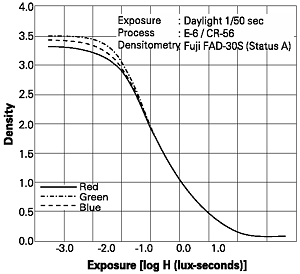
This is the characteristic
curve
for Kodak
Supra 100 negative film (now discontinued, but
typical). Supra 100 responds to a Log Exposure range
of about 3, equivalent to a (linear) range of 103
= 1000 =
10 f-stops, far
more than slide film. |  | |
 |
 Fujichrome
Astia 100 (left) has a significantly larger
exposure range than
Velvia 50, Provia
100F, or Ektrachrome
100VS. This should make it superior in many instances for
scanning,
even though the reduced contrast makes the slides themselves less
"snappy."
It gets a lot less press than Provia or Velvia (which has an even
shorter range than Provia). I haven't tried
it. Fujichrome
Astia 100 (left) has a significantly larger
exposure range than
Velvia 50, Provia
100F, or Ektrachrome
100VS. This should make it superior in many instances for
scanning,
even though the reduced contrast makes the slides themselves less
"snappy."
It gets a lot less press than Provia or Velvia (which has an even
shorter range than Provia). I haven't tried
it.
The exposure range film can
respond to, particularly
negative film, is further limited by flare
light— light that bounces
off the interiors of lenses and between the elements. Flare light fogs
shadow regions. It tends to be worse for zoom lenses than for primes
(single
focal length lenses) because zooms have more elements. The primary
purpose
of lens coatings is to reduce flare. Flare light originates from bright
areas— often light sources— inside or outside the
frame. It it's inside
the frame, you just have to hope the lens is well enough designed to
keep
it under control. It it's outside, a lens shade is helpful. You can use
your hand or a hat to shield the lens from glaring light sources like
the
sun. When flare is taken into consideration, the actual exposure range
of negatives is reduced to between 7 and 9 f-stops. Because of flare
light,
it is generally unwise to meter from regions darker than zone 3.
Of course Ansel
Adams could
capture
longer ranges by using short development times (normal minus;
N-). He also used small aperture view camera lenses with few elements,
and he often used an adjustable bellows lens shade to control flare. He
was shown next to one mounted on his view
camera in a 1970's TV commercial. Nobody knows how many Toyotas
(Datsuns?) he
sold,
but camera shops around the country sold out their tiny
stocks of bellows lens shades.
 Characteristic
curves of digital cameras can
now be measured, thanks to the Imatest
program. The total dynamic range, shown here for the Canon EOS-10D at
ISO 400, is almost 9 f-stops: nearly as good as
negative film. (It may be better; the measurement was limited by the 10
f-stop range of the Kodak Step Tablet.) The practical dynamic
range— specified by
the
maximum allowable noise for a specified level of image
quality—
depends on the ISO speed. See the Imatest Stepchart
tour for more details. Characteristic
curves of digital cameras can
now be measured, thanks to the Imatest
program. The total dynamic range, shown here for the Canon EOS-10D at
ISO 400, is almost 9 f-stops: nearly as good as
negative film. (It may be better; the measurement was limited by the 10
f-stop range of the Kodak Step Tablet.) The practical dynamic
range— specified by
the
maximum allowable noise for a specified level of image
quality—
depends on the ISO speed. See the Imatest Stepchart
tour for more details.
The characteristic curves
provide
valuable information
on contrast or gamma,
which is proportional to the average slope— the change in
Density for
a corresponding change in Log Exposure— over the film's
sensitivity
region.
The green (G) curve is most appropriate because the eye is most
sensitive
to green. For EV100VS slide film, gamma = (0.3-3.3)/(-0.3+2) = -3/1.7 =
-1.76. For Supra 100 negative film, gamma = (2.5-0.8)/(1.0+2.0) = 1.7/3
= 0.57. EV100S is three times
contrastier than Supra
100, making it much contrastier than the original scene. Very punchy. Film
gamma is closely related gamma
in digital displays, where brightness = (pixel level)gamma,
and hence log(brightness) = gamma * log(pixel
level). For
negatives, scanner contrast is
set much higher
than for slides. Papers for printing negatives also have much
higher
contrast.
That makes the scanner more sensitive to dust, scratches, and grain,
giving
slides an advantage for softly lit, low contrast
subjects. Since I now use a digital SLR, which combines the best
features of slides (low noise) and negatives (large exposure range),
I've put this particular debate behind me. |
|
| Equations
for zones |
The equation is expressed in the
following Matlab
statements. zone = 1:9;
gamma1 = 2.2; gamma2
= 1.8; f1 = 5.25;
y1 =
(exp(f1*sin(pi*(zone-1)/16))-1)/(exp(f1)-1);
% Normalized screen levels.
z1 = y1.^(1/gamma1); z2 =
y1.^(1/gamma2);
% Normalized pixel levels.
px1 = round(255*z1); px2
= round(255*z2);
% Pixel levels for gamma = 2.2, 1.8
 y1
is the normalized screen luminance. There's nothing sacred or unique
about
this equation— it's simple and does the job. It's designed so
y1 = 0
for
zone 1, y1 = 1 for zone 9, and y1 = 0.21 (21%) for zone 5 (what I
perceive
to be middle gray). The sin function is responsible for the compression
required at high pixel levels. f1 is set to 5.25 to make y1 = 0.21
(21%)
for zone 5. z1 and z2 are the normalized pixel levels (0-1) for gamma =
2.2 and 1.8, respectively. px1 and px2 are the corresponding actual
pixel
levels (0-255). y1
is the normalized screen luminance. There's nothing sacred or unique
about
this equation— it's simple and does the job. It's designed so
y1 = 0
for
zone 1, y1 = 1 for zone 9, and y1 = 0.21 (21%) for zone 5 (what I
perceive
to be middle gray). The sin function is responsible for the compression
required at high pixel levels. f1 is set to 5.25 to make y1 = 0.21
(21%)
for zone 5. z1 and z2 are the normalized pixel levels (0-1) for gamma =
2.2 and 1.8, respectively. px1 and px2 are the corresponding actual
pixel
levels (0-255). The
results are screen levels y1 =
{ 0.0000
0.0094 0.0341 0.0922 0.2107
0.4097
0.6688
0.9035 1.0000 }. Pixel levels for gamma = 2.2 are {
0
31
55 86 126 170 212 244 255 Decimal} = { 0
1F 37
56 7E AA D4 F4 FF
Hexidecimal}.
Pixel
levels for gamma = 1.8 are { 0 19 39 68
107 155 204
241
255 Decimal} = { 0 13 27 44
6B 9B
CC
F1 FF Hexidecimal}. |
|
The
history
of the Zone system, or was
Ansel
Adams the sole inventor? Here's what Adams says in his
Autobiography.
The setting is the Art Center School, Los Angeles, 1940. "With the
cooperation
of Fred Archer, instructor in photographic portraiture, I set out to
plan
a way by which the students would learn the 'scales and chords' to
achieve
technical command of the medium. It took several weeks in refinement
before
I could teach it to the students. I called my codification of practical
sensitometry the Zone System."
I found no mention of Archer in my 1964 edition of
Adams' classic
text,
"The Negative," but Christian Boesgaard wrote, " In my 1981 edition, Adams elaborates on the origins of the zone system in
the Introduction. He states that it was done with the "cooperation of
an important instructor, Fred Archer," and, "We based our first plan on
articles by John L. Davenport that appeared in U.S. Camera in the
Autumn and Winter edition of 1940" (citations from page xi)."

| Images
and text copyright © 2000-2013 by Norman Koren. Norman Koren lives
in Boulder, Colorado, where he worked in developing magnetic recording
technology for high capacity data storage systems until 2001. Since 2003 most of his time has been devoted to the development of Imatest. He has been involved with photography since 1964. |
 |