Understanding
image sharpness part 3:
Printers
and prints
by Norman
Koren
updated
Dec. 10, 2002
In this page we discuss printers and prints and how to
characterize their sharpness and resolution. We deal with the issue of
how many pixels per inch are required for a sharp print.
I owe an acknowledgment to Peter
Nelson , whose excellent study
of printer resolution , discussed in a photo.net
post , gave me the idea of pursuing this line of thought. When I wrote this
(May 2001) I knew of no standard for printer sharpness and/or resolution.
I still don't.
| Green is for
geeks. Do you get excited by a good equation? Were you passionate
about your college math classes? Then you're probably a math geek— a member
of a maligned and misunderstood but highly elite fellowship. The text in
green is for you. If you're normal or mathematically challenged, you may
skip these sections. You'll never know what you missed. |
Printer
/ print sharpness
Now that we've discussed sharpness and MTF in film, lenses, scanners and
sharpening algorithms, a few questions remain.
-
How can we define the sharpness of prints and printers?
-
How many image pixels per inch are needed to make a sharp print?
-
How much of an advantage does a 4000 dpi scanner have over a less expensive
2400-2800 dpi scanner for various print magnifications?
The answers must be determined experimentally because there are no convenient
mathematical equations for characterizing printers. There are several reasons.
-
The printer's dpi specification is meaningless
;
it is merely the stepper motor pitch. Epson
specifies the "resolution" of its new 1280 printer as 2880
x720 dpi. Horsefeathers!
(For non-English speakers, "Horsefeathers" is the title of an old Groucho
Marx film, implying the ridiculous or absurd.) It takes several dots to
reproduce one full toned pixel. Reviews of the Epson 1280 noted that actual
resolution (i.e., the visual appearance) at the 2880 dpi setting is only
marginally better than 1440 dpi (the Epson 1270 "resolution").
-
Print quality is affected by the image editing software, which processes
the pixels before sending them to the printer. Picture
Window Pro resamples the image using bicubic interpolation
before sending it to the printer. Results are very sharp. Prints made with
a simple Microsoft program that came with my original HP Photosmart printer
were distinctly softer.
-
Ink spreads when applied to paper, and it spreads differently on different
papers (glossy tends to be sharper than matte). Printer software is designed
to compensate for the overall tonal effects of ink spreading, but it doesn't
affect resolution.
The only way to determine a printer's sharpness capability, which includes
the effects of software, ink and paper, is to make test prints over a practical
range of magnifications.
The sharp print—
a preliminary criterion
In my research for the Depth of field page I learned
about a criterion for print sharpness that was used to design the depth
of field scales on lenses with focusing mounts back in the 1930's. The
smallest distinguishable feature on an 8x10
inch print viewed at a distance of about 10 inches was assumed to be 0.01
inch. When a pinpoint image is misfocused, it becomes a circle known as
the circle of confusion. Depth of field scales are set for a 0.01
inch circle of confusion on an 8x10
inch enlargement (0.032mm on 35mm film to be enlarged 8x).
Studies on human
visual acuity suggest that the smallest feature an eye can distinguish
on an 8x10 inch print at 10 inches
is more like 0.003 inches. At the depth of field limit, sharpness is only
one
third of what the eye can distinguish.
A circle, like all physical shapes, has a characteristic MTF
(spatial frequency response). For a circle of diameter C, the spatial
frequencies for MTF = 50%, 20% and 10% ( f50
,
f20
and f10 ) are,
f50 = 0.72/C
; f20 = and
1/C ; f10
= 1.11/C
f50
is familiar from film, lenses and scanners. f20
is interesting because it is the inverse of C. For C = 0.01
inch, f50 = 72 line pairs per inch (lp/in); f20
= 100 lp/in; f10 = 111 lp/in. We use
f50
as a standard of comparison since it is most closely correlated with perceived
sharpness.
Would I call a print with f50
= 72 lp/in "sharp as a tack?" Hardly. It corresponds to about 40% of the
achievable sharpness of an excellent 35mm camera lens. Contact prints are
certainly much sharper, and the additional sharpness contributes to their
clarity and luminosity. I would call f50 = 72 lp/in
"pretty good" for an 8x10 inch print. 90 lp/in would be "very good." 110
lp/in would be "excellent"— "tack sharp" by any standards. These are my
estimates for now, based on a comparison of prints I've made with results
to be presented below; they may be adjusted in the future. If anything,
they are somewhat conservative.
Of course perceived sharpness depends on print
size, viewing distance and viewer expectation. The larger the print the
less sharp it needs to be. A technically perfect 35mm image enlarged to
16x24 inches can look quite sharp at
a normal viewing distance— about 20 inches— it can achieve the "pretty
good" level, but a well done medium format or 4x5
image will blow it away on close examination. That's why people take the
trouble of using big, heavy, slow view cameras.
.
Printer
test target
The 0.5 mm target used in Parts 1 and 2
is too small for printer tests; it was designed to illustrate film image
sharpness on a video monitor. It contains several pixels per scanned pixel,
and as such it doesn't represent an actual pixel-for-pixel scan. At 10x
print magnification the length of the print would only 0.5 cm (0.197 inches).
For that reason we developed a new virtual target for printer tests
that represents 1 cm (10 mm = 0.394 inch) on film. As with the previous
target, spatial frequency varies from 2 to 200 lp/mm on a logarithmic scale,
but the new target contains the same number of pixels as an actual scan.
A typical target (reduced to fit on a web page) is illustrated below. We
have chosen sharpened Provia for many of our tests because it is about
as sharp as you can get with color film. Before it was discontinued, I
used Kodak Supra 100 negative film for most of my work, but no MTF data
was available. I'd guess it's as sharp as Provia but somewhat grainier.
 This 750 pixel wide GIF image is not
the actual 1575 pixel wide target, which is a downloadable
TIFF file. Some Moiré fringing due to interaction between the pattern
and screen pixels is visible and unavoidable. The target is divided into
five zones. From bottom to top they are,
This 750 pixel wide GIF image is not
the actual 1575 pixel wide target, which is a downloadable
TIFF file. Some Moiré fringing due to interaction between the pattern
and screen pixels is visible and unavoidable. The target is divided into
five zones. From bottom to top they are,
-
The original target, without the effects of the film and lens, sampled
at the specified rate (4000 dpi here; 2400 and 8000 dpi are also available).
Anti-aliasing has been applied.
-
An area for the label and tic marks. Major tic marks (left to right) are
for 2, 3, 4, 5, 6, 7, 8, 9, 10, 20, 30, 40, 50, 60, 70, 80, 90, 100, and
200 lp/mm. Minor (short) tic marks (left to right) are for 2.5, 3.5, 15,
25, 35, and 150 lp/mm. This is standard for a logarithmic scale.
-
The pattern illustrating the effects of the film and "excellent"
lens. Areas where film adjacency effect or digital sharpening renders
the original density, which varies between 0 and 1 (black and white), less
than 0 or greater than one are displayed as 0 and 1, i.e., this image is
"clipped.".
-
The target illustrating the effects of the film and lens, but this time
normalized so the minimum density is 0 and the maximum is 1 (no clipping).
If there is any sharpening (film adjacency effect or digital), the overall
target contrast will be decreased. There are thin gray strips between sections
3, 4 and 5.
-
The target illustrating the effects of the film and lens, as in 4, but
with the contrast gradually reduced until it reaches density = 0.5 (middle
gray) at the top.
Targets are available representing Provia and Velvia films with the "excellent"
lens scanned at 2400 and 4000 dpi, with and without sharpening. There is
also a target for Provia unsharpened at 8000 dpi. You can learn how to
download and use them in
How the result are
obtained, below. The Nyquist frequency— the frequency beyond which
response is a form of garbage called aliasing, is 47.2 lp/mm for
2400 dpi scans and 78.7 lp/mm for 4000 dpi scans (half the scan dpmm).
Some anti-aliasing is applied to the original pattern below the Nyquist
frequency to minimize interference between the pattern and the sampling
rate. This represents actual scanner performance and sets limits on print
sharpness at large magnifications.
Results
for scanned prints
The targets were printed at magnifications of 4x,
8x, 12x
and 16x, then scanned with the
Epson 1640SU. Except as noted (in purple
in the tables below), prints were made and scanned under the following
conditions.
-
Three targets were used: the original pattern and Provia unsharpened and
sharpened. A reminder: the targets for Provia are based on
simulation, and hence represent the best that can be accomplished:
no camera shake (good tripod), good focus, etc. Very sharp images.
-
The Epson 1270 was set for Color Ink, Photo-1440 dpi, High Quality Halftoning,
Gamma = 2.2.
-
The targets were printed lengthwise along the direction of paper motion,
i.e., vertical in a portrait format print.
-
Epson Premium Semigloss Photo paper was used.
-
Images were scanned by the Epson 1640SU at its default settings. The contrast
and brightness of the scanned images were adjusted for minimum and maximum
densities of 0 and 100%. I used the 1600 dpi setting
for magnifications of 4x and 8x;
800 dpi for higher magnifications (file sizes got enormous at 1600 dpi).
At 1600 dpi, the 1640SU can resolve far more detail than the naked eye;
it is more than adequate for evaluating print sharpness. Through a 10x
loupe the scanned images are very nearly as sharp as the prints themselves.
I didn't resize any of the targets prior to printing.
-
The display images below (and also in part 4) illustrate
the scanned target between 10 and 100 lp/mm (the same as the target segments
illustrated above). The corresponding print density (lp/in) equals (target
(film) density (lp/mm)) / magnification * 25.4 = target density * 6.35
at 4x magnification, where 10 to 100
lp/mm on the target corresponds to 63.5 to 635 lp/in on the print.
-
The density plot shows 2 to 100 lp/mm (referenced to the target). There
isn't much to show over 100 lp/mm (it's all aliasing). In most cases the
scan illustration shows portions of bands 1 and 3 (original target on bottom
and clipped, contrasty image on top).
-
Assuming 75 pixels per inch screen resolution, the screen magnification
(relative to print size) for these 0.5 cm = 0.197 inch target segments
is 788 / (75* 0.197 * print magnification) = 53.3 / (print magnification).
The scan below is greatly magnified compared to the actual 4x
print: 13.3x.
The scanned prints were analyzed for MTF using Mtfscan.m. Because
the response of the scanned prints contains large irregularities at high
spatial frequencies, I visually estimated the 50% and 10% MTF frequencies
( f50 and f10 ) from the Mtfscan
plots. Details below.
Only one complete result will be illustrated here: for 4x
magnification. This image is used to find the printer's ultimate sharpness.
Additional images, shown in part 4, illustrate
print sharpness at different magnifications.
Print magnification: 4x
Illustrates ultimate
printer sharpness
4000 dpi scan; 1000 dpi sent to printer
Screen magnification @ 75 pixels per inch: 13.3
Note the missing tic marks! It might be wise to resize this image down
(to 500 dpi or below) before printing (practically speaking, this is almost
never a problem). A small amount of color fringing is visible around some
of the edges. These colors are barely visible to the naked eye, but they
show up quite clearly under a 10x loupe.
The ultimate printer sharpness can be derived from the density curves
at 4x magnification. For the original
target, f50 and f10
are 120 and 190 lp/in on the print (19 and 30 lp/mm referenced to the film).
For the sharpened Provia, f50
and f10 are 165 and 190 lp/in on the print (26
and 30 lp/mm referenced to the film). Response above 190 lp/in is mostly
aliasing— garbage. Sharpening improves the image resolution, even at low
magnifications. The effects of sharpening, which boosts MTF at high spatial
frequencies, are illustrated below.
These density curves may look ugly, but the 1270 is an outstanding printer
capable of making extremely sharp images. These results are extremely
sensitive; they reveal the finest details of printer performance. f50
= 120 lp/in is impressive performance. |
More of these images are in part 4 .
How many image pixels
per inch (ppi) do you need to send to the printer?
There is no one-size-fits-all answer, but the table below gives a strong
indication of what to expect. Remember, the total image pixel size and
print size are what you use for this calculation. You may be confused by
an image size specified as 8x10 inches at 250 ppi. The actual image is
2000x2500 pixels— you can print it
any size you want.
300 dpi is sufficient for excellent sharpness for all magnifications,
even in small prints. There is little improvement beyond 300 dpi. Results
are still very good at 250 dpi. For large prints intended to be viewed
at a distance, you can get by with well under 250 dpi.
Below about 200 ppi, print resolution is beneath the capabilities of
the 1270 printer; it's pretty much based on the original image. For a sharp
image, f50 is roughly 0.4*ppi. Sharpening always
improves things somewhat. Large prints at 150 dpi, for example a 2400 dpi
scan from 35mm film printed at 16x (16x24 inches), have adequate sharpness
for their size, even though they don't quite meet the "pretty good" standard
for small prints (that would require a 4000 dpi scanner). They won't come
close to good scans from medium and large format film, but if they're sharp
to begin with, they won't look bad either.
If your image is soft to begin with, you won't benefit from the full
300 dpi. If I'm scanning 35mm film and I don't plan to print larger than
8x10, I usually set my Canoscan FS4000US scanner to 2000 dpi (the next
step below its maximum of 4000 dpi). This speeds things up a lot and I
can still print at 250 dpi— sufficient for all but the most insanely critical
applications.
Resizing the image to a higher resoluton generally does very little
to improve printer sharpness— you are limited by the information in the
original file. Resizing with sharpening might help a little, but don't
expect much. Remember, the image editor resizes the image— transparently
to the user— when it sends it to the printer. You never need to worry
about the exact correspondence between the ppi of your print and the dpi
"resolution" of the printer.
Print
sharpness for the original target
for the Epson 1270
set at highest print quality
Test (
unless noted,
4000 dpi scan,
Semigloss) |
Print magnifica-
tion / pixels per
inch to printer |
f50
lp/mm
ref. film |
f10
lp/mm
ref. film |
f50
lp/in
print
Sharpness |
f10
lp/in
print
Resolution |
Comments |
| Original target |
(target) |
65 |
110 |
n/a |
n/a |
|
| Provia unsharpened |
(target) |
32 |
61 |
n/a |
n/a |
For comparison
with original target. |
| Provia sharpened 0.37 |
(target) |
62 |
85 |
n/a |
n/a |
Sharpening brings f50
close to original target. |
| Original target 4x |
4x / 1000 |
19 |
30 |
120 |
190 |
4x prints reflect ultimate
printer resolution. |
Original target rotated 90o
(direction of print head) |
4x /1000 |
17 |
27 |
108 |
171 |
About 10% lower resolution
than the standard direction. |
Original target
Matte Heavyweight |
4x /1000 |
18 |
27 |
114 |
171 |
Very close to Semigloss;
better than expected. |
| Original target 8x |
8x / 500 |
35 |
50 |
111 |
158 |
Excellent |
| Original target 12x |
12x / 333 |
50 |
65 |
106 |
137 |
Excellent |
| Original target 16x |
16x / 250 |
54 |
70 |
86 |
111 |
Very good |
Now let's look at sharpness for a film image (simulated, so it indicates
what you'd get under ideal conditions).
Print
sharpness for Provia film
for the Epson 1270
set at highest print quality
Test (
unless noted,
4000 dpi scan,
Semigloss) |
Print magnifica-
tion / pixels per
inch to printer |
f50
lp/mm
ref. film |
f10
lp/mm
ref. film |
f50
lp/in
print
Sharpness |
f10
lp/in
print
Resolution |
Comments |
| Provia unsharpened |
(target) |
32 |
61 |
n/a |
n/a |
|
| Provia sharpened 0.37 |
(target) |
62 |
85 |
n/a |
n/a |
Close to original target. |
| Provia sharpened 0.37 |
4x / 1000 |
26 |
30 |
165 |
190 |
Shows improvement from
sharpening, even at low
magnification. |
Provia sharpened 0.37
rotated 90o |
4x / 1000 |
19 |
27 |
120 |
171 |
" " |
Provia sharpened 0.37
Matte Heavyweight |
4x / 1000 |
18 |
29 |
114 |
184 |
|
| Provia unsharpened |
8x / 500 |
24 |
40 |
76 |
127 |
|
| Provia sharpened 0.37 |
8x / 500 |
41 |
52 |
130 |
165 |
|
Provia sharpened 0.37
2400 dpi scan |
8x / 300 |
31 |
41 |
98 |
130 |
|
| Provia unsharpened |
12x / 333 |
27 |
45 |
57 |
95 |
Needs sharpening! |
| Provia sharpened 0.37 |
12x / 333 |
46 |
56 |
97 |
118 |
Still very sharp. |
Provia sharpened 0.37
2400 dpi scan |
12x / 200 |
35 |
43 |
74 |
91 |
Reasonably sharp; 76%
of 4000 dpi scan. |
| Provia sharpened 0.37 |
16x / 250 |
51 |
66 |
81 |
104 |
Very large; still OK. |
Summary
-
 Based
on the original target printed at 4x
magnification, the Epson Photo Stylus 1270 has a resolution limit of about
120 lp/in at the 50% contrast level and 190 lp/in at the 10% level— extremely
sharp; perhaps as good as the naked eye can see at reasonable viewing distances.
Epson's specified "resolution" of 1440 dpi is merely the maximum dot density—
the spacing of the stepper motor. Most of the time print sharpness is usually
limited by the image and the scanner rather than the printer.
Based
on the original target printed at 4x
magnification, the Epson Photo Stylus 1270 has a resolution limit of about
120 lp/in at the 50% contrast level and 190 lp/in at the 10% level— extremely
sharp; perhaps as good as the naked eye can see at reasonable viewing distances.
Epson's specified "resolution" of 1440 dpi is merely the maximum dot density—
the spacing of the stepper motor. Most of the time print sharpness is usually
limited by the image and the scanner rather than the printer.
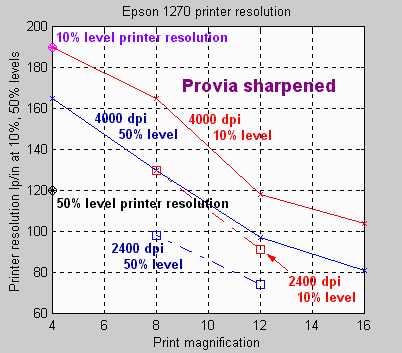
-
The 1270's perceived sharpness ( blue;
most related to the 50% MTF level) and resolution (
red; most related to the 10% MTF level) are summarized in the
curve on the right for sharpened Provia, which is about as sharp as color
films
get. The margin of error is about ±4% at the 50% MTF level and ±10%
at the 10% level.
-
The resolution at the 50% level for the sharpened Provia is greater
than the printer's resolution with the original target because sharpening
reduces low frequency components relative to high frequencies. The ultimate
resolution (closer to the 10% level) is relatively unaffected. Details
are illustrated in
part 4.
-
Sharpening always improves perceived
print sharpness. It compensates for some of the MTF rolloff in the film,
lens and printer. It should be performed whenever possible. But care must
be taken to prevent smooth areas from skies from becoming grainy. This
is done through the use masks and thresholds in unsharp mask.
-
The advantage of medium format is that it only requires about 1/2 to 2/3
the magnification of 35mm. Big advantage! But 4000 dpi scanners for medium
format are very expensive: over $2,500. Very nice if you can afford one.
-
This could be a good starting point for an industry standard for printer
sharpness, though consumer interest might be limited. The 1270 is extremely
sharp as it is; a sharper printer wouldn't appear much better to the naked
eye.
-
A 2400 dpi scan can look very good at 8x
and pretty good at 12x magnification,
but a 4000 dpi scan has an advantage, even at 8x.
I discuss scanners in Making
fine prints. I now use a Canon FS4000US
CanoScan for most of my 35mm work (except for panoramic images). Inexpensive
2400 dpi flatbed scanners don't seem to have as good resolution as
2400 dpi dedicated film scanners.
How
the results are obtained
The printer test
targets are created by the Matlab program, MTFcurve.m
, which you can download on your computer and
run if you have Matlab installed
(I have version 5.3). It is run exactly as described in Part
2 , except that the first argument, the 50% MTF frequency of the lens,
is entered as a negative number. Here are two examples. Comments follow
the %-sign.
mtfcurve
-45 13 61 2 2400/25.4 %
Velvia, excellent lens, 2400 dpi, unsharpened.
mtfcurve -40
0 61 2 4000/25.4 .37 % Provia, excellent lens, 4000 dpi, sharpened
with ksharp = 0.37
Portions of two targets are illustrated below actual
size— 1 screen pixel per target pixel— for 10 to 100 lp/mm, the region
of greatest interest. These segments represent 788/1575 cm = 0.5 cm (0.197
inch): half the original 4000 dpi target, which varies from 2 to 200 lp/mm.
The 50% and 10% MTF points for Provia with the excellent lens sharpened
with ksharp = 0.37 (the upper pattern in the upper image, below) are 57.4
and 82.5 lp/mm. The 50% and 10% MTF points without sharpening (the upper
pattern in the lower image, below) are 26.8 and 55.3 lp/mm. The sharpened
plot has outstanding resolution— close to the ideal target for the 4000
dpi scan— because the maximum sharpening boost takes place at 78 lp/mm—
half the sampling frequency. From these images it appears that the 10%
MTF point provides a reasonable estimate of the limit of visible resolution.
The 50% MTF point is more associated with perceived sharpness.


Download
the targets
Targets can be downloaded by right-clicking on the
appropriate file name in the table below. All contain text labels. They
have been rotated 90 degrees from the normal orientation (above) for optimum
TIFF data compression.
Using the targets
The first thing you'll want to do once you've saved
a target is to load it into your image editing program is to rotate it
90 degrees and have a close look at it at 1:1 or larger magnification.
You may want to sharpen it to see how real sharpening compares to the computer
model (they should be very similar with Radius = 1). You can rotate or
resize it, but you should be aware that rotation by angles other than ±90
or 180 degrees and resizing invoke an anti-aliasing algorithm that may
soften the image slightly. You can change the target color to C, Y, M,
etc. If you make changes, be sure to save them with different file names
so you don't lose the original.
Now you are ready to print the target. You may
want to print the original version before you try the modified versions.
The narrowest print the Epson 1270 can handle is 3 inches wide. I cut 8.5
x11 inch (letter sized) paper into 4.25
x11 and 3.5x8.5 inch strips
for the tests. The larger size is used only for magnifications between
18 and 26 (as high as I need to go).
The print magnification is equal to the length
of the image in cm. I made prints at magnifications of 4, 8, 12, and 16x
(4 cm, etc.). Each magnification has different attributes: at 4x
sharpness is entirely limited by the printer; at 16x
it is limited by the target. 8x and
12x represent typical magnifications
for letter (8.5½x11 in) and
A3 images (11.7x16.5 in) from 35mm,
respectively.
You can learn a lot by studying the prints with
the naked eye and under a loupe. But if you have a high resolution scanner,
you can take the analysis much further.
The prints were scanned on the 1600 dpi Epson
1640SU Photo scanner, which is a flatbed hybrid that can also scan film.
(A cheap 300 dpi optical resolution scanner won't do.) I used the 1600
dpi setting for magnifications of 4x
and 8 x; 800 dpi for higher magnifications
(file sizes got enormous at 1600 dpi). At 1600 dpi, the 1640SU can resolve
far more detail than the naked eye; it is more than adequate for evaluating
print sharpness. Through a 10x loupe
the scanned images are very nearly as sharp as the prints themselves. I
didn't resize any of the targets prior to printing.
Analysis
of targets and scans
| I've written a Matlab program, MTFscan.m
, that plots print density as a function of spatial frequency for the 10
mm target. You can download it by shift-clicking here
. Matlab must be installed to run
it. I have version 5.3. A $99 student
version is available at campus bookstores. If you're reading this,
you must be a student (of sorts). You can also use a public domain program,
ImageJ,
for the analysis. It works very nicely— all it lacks is a proper logarithmic
x-axis scale, but it can be easily computed.
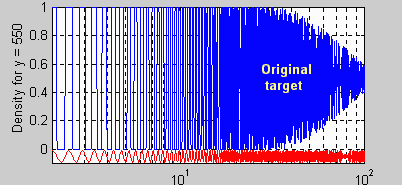
Typical MTFscan outputs are illustrated on the
right for targets (not yet for scanned prints, which will be tackled shortly).
The first image is the the density vs. spatial
frequency for the original pattern without the effects of film or lens;
band 1 of the above target and the lower part of the above segments. The
rolloff is due to the sinc3 sensitivity of the film scanner,
discussed in part 2 , which is necessary
for anti-aliasing. At 4000 dpi = 157.5 dpmm, response above 78.7 lp/mm
(the Nyquist frequency) consists of aliasing— artificial low frequencies
and displaced edges. I use the red sine curve on the bottom when I zoom
in on Matlab plots to check for aliasing. |
|
 |
Because the response of the scanned prints contains
large irregularities at high spatial frequencies, I visually estimate the
50% and 10% MTF frequencies ( f50 and f10
)
from the plots. These estimates have about a ±4% margin of error
for f50 and ±10% for f10
,
where more irregularities are visible.. The 50% frequency is associated
with perceived image sharpness; the 10% MTF frequency is associated with
perceived lp/mm resolution. See
part 1 .
For the original pattern (above right), f50
and f10 are 65 and 110 lp/mm.
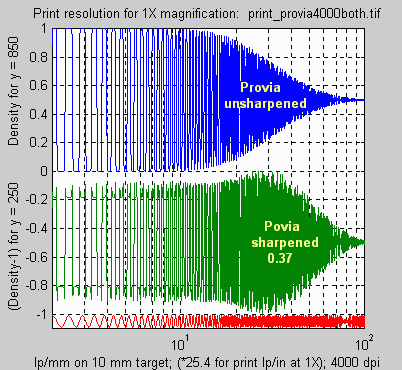
The upper plot in the figure to the right is the
density vs. spatial frequency for Provia with the excellent lens scanned
at 4000 dpi, unsharpened. The 50% and 10% MTF frequencies are 32 and 61
lp/mm.
The lower plot is for Provia sharpened with ksharp
= 0.37 (radius = 1); band 4 of the above target. The characteristic sharpening
at contrast boundaries and high frequency boost is apparent. Because this
boost tends to get lost in prints and contrast is adjusted accordingly
when prints are made, we reference f50 and f10
to the steady-state low frequency response, which is about 0.63, since
this plot is normalized to 1 at the maximum. f50
and f10 are 62 and 85 lp/mm, much
higher than the unsharpened image. Later we will look at similar plots
for scanned prints. |
|
 |
These plots are similar, though not precisely
identical, to MTF plots. The difference is that the input target to an
MTF plot must be sinusoidal. I used steps (derived from a sine function)
because they provide more visual information about image sharpness. At
high spatial frequencies, where the response becomes sinusoidal, these
plots are identical to MTF.
| Mixed
units I use familiar units for describing resolution.
For better or worse that means using line pairs per mm on film and
targets and line pairs per inch on prints. It gets confusing— I
had to correct several errors. On the other hand, using less familiar units
would also be confusing.
Mixing units in this way is not without its perils.
It lead to the crash
of the $125 million Mars Orbiter on September 23, 1999. |
Running MTFscan
-
MTFscan.m and Matlab must
be on your computer.
-
The scanned target should be horizontally aligned
so that spatial frequency increases from left to right. Rotate 90 degrees
in your image editor if necessary. Recall that rotations by other
than ±90 or 180 degrees invoke an anti-aliasing routine
that may reduce sharpness.
-
Carefully crop the left and right of the scanned
target at the centers of the 2 and 200 lp/mm tic marks (the extreme left
and right of the target). I adjust the brightness and contrast (using Picture
Window's Levels and Color... transformation) so the minimum and maximum
densities are 0 and 100%.
-
Save the cropped image in a standard file format
and extension, preferably tif. Matlab also supports bmp, png, and jpg.
-
Run MTFscan with the command, mtfscan
filename.ext % (ext is typically tif)
-
The image will be displayed along with axes that
indicate the x and y-coordinates.
-
Enter the y-coordinates of the first pattern to scan.
-
Enter the y-coordinates of the second pattern to
scan; none if only one plot is desired.
-
Enter the print magnification; 1 for an original
target.
It's a good idea to add labels to the plots,
e.g., "Original target," "Provia unsharpened," etc.
|
|
Part 4: Epson 1270
test results

|
Images
and text copyright © 2000-2013 by Norman Koren. Norman Koren lives
in Boulder, Colorado, where he worked in developing magnetic recording
technology for high capacity data storage systems until 2001. Since 2003 most of his time has been devoted to the development of Imatest. He has been involved with photography since 1964. |
 |