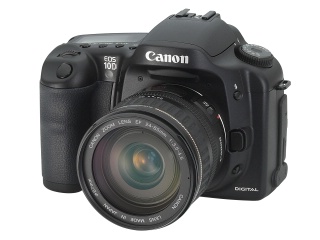
The Canon EOS 10D Digital SLR:
Impressions and techniques Part 4
by Norman Koren
|
|
|
| In
Part 1 we introduced the EOS 10D
and covered many of its operating modes. In Part
2 we continued with a description of storage formats, a comparison
with the Nikon D100, descriptions of Raw conversion programs, and flash
operation.
In this part we discuss resolution and image
quality, and we present conclusions.
|
 |
 A.
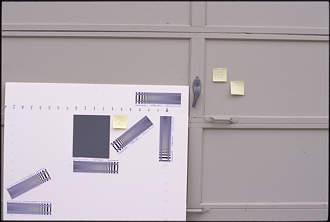
Test target framed for 35mm.
A.
Test target framed for 35mm.
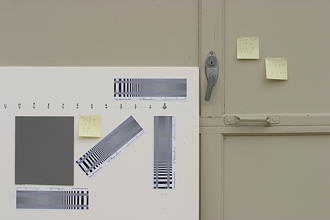
An image of the test target, framed for analyzing 35mm film, is shown
on the right. A detail can be found in Lens
testing. The target contains several test charts, each of which
contains bar and sine patterns designed to indicate the correct spatial
frequencies in lp/mm (from 2 to 200) when imaged at a length of 5 mm on
the film or digital sensor. The target also contains a scale that decreases
from 18 on the left to 0 on the right. The scale marks, placed every 5
cm on the target are intended to represent 1 mm on the film or sensor.
I place the mark below 0 in the center of the image and used the scale
to set the camera-to-target distance. For a 24x36
mm 35mm frame, shown in the illustration, I placed the 18 mark at the left
of the frame, representing half the 36 mm image width. I didn't get it
perfect-- I was a little too far from the target. Canon EOS viewfinders
show about 95% of the frame, so you have to compensate, making small errors
unavoidable. And yes, I have trouble leveling images.
 B.
Test target framed for the EOS 10D.
B.
Test target framed for the EOS 10D.
Details:
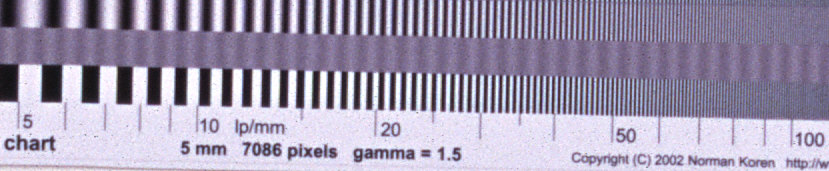
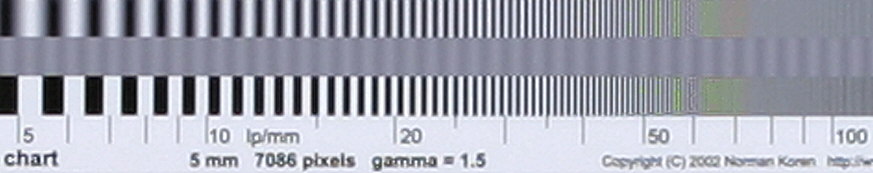
| All images are tightly cropped to show approximately the same area
of the chart closest to the center of the target, from just under 5 lp/mm
to just over 100, showing (top to bottom) the sine pattern, the 10% MTF
reference pattern, and the bar pattern.
1. EOS 10D, 70-200 f/4 L, 70 mm at f/8, ISO 100, taken in RAW format and converted with default settings (normal sharpening). Response is strong to 50 lp/mm but gone by 60. 1A, below, is a 1.845x enlargement that shows more detail at high spatial frequencies. This result is consistent with Dpreview.com, where response disappears around 18 on the PIMA/ISO 12233 standard resolution test chart, equivalent to 1800 line widths (900 line pairs) per picture height (15.1 mm) = 59.6 lp/mm.  2. Provia 100F, 70-200 f/4 L, 70 mm at f/8, scanned at 4000 dpi, taken at the same distance as 1 (standard framing for 35mm images; B, above). No additional Unsharp Mask (though it would benefit this image). Response is weak (under 10% MTF) above 50 lp/mm and continues, albeit faintly, to around 70 lp/mm. Total image size is 1.59x larger than 1. 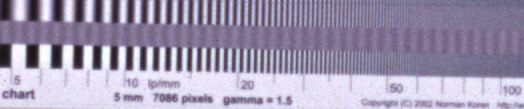 3. Provia 100F, 70-200 f/4 L, 70 mm at f/8, scanned at 4000 dpi, with the camera moved closer to the target so the 24x36 mm film image covers the same area as the EOS 10D image 1 (A, above). Scale readings must be divided by 1.59. 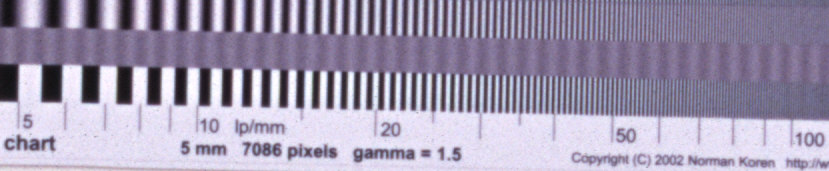
.
|
Observations: If you're comparing the resolution limit-- the highest spatial frequency with visible detail-- in the appropriate images (3A and 1A), film wins hands down. On film (3A), detail is visible to beyond 90 (56 lp/mm actual spatial frequency; 2700 line widths per picture height (lw/ph)), but only to about 60 lp/mm (1800 lw/ph) in the comparable 10D image (1A). The text below the pattern is clearer in film. Response drops more gradually for film than for digital images.
On the other hand, if you move back one meter or more from the monitor and compare the film image (3A) with the comparable digital image (1A), digital comes off quite well. Digital MTF is comparable to film in the important 35-50 lp/mm range (41-58 lp/inch in a 13x19 inch print). Film's weak response (low MTF) above 60 lp/mm contributes little to image quality. The absence of grain and noise is a plus for digital images. (These tests were done at ISO 100, but noise remains very low at ISO 400.)
Image quality of the EOS 10D is comparable to 35mm film, even though it differs in details. Whether you find digital or film to be superior is a matter of personal taste and depends on the subject (highly detailed, textured subjects tend to favor film). My comparisons in Digital cameras vs. film favor film more than these tests indicate.I've received correspondence from people in both camps: some prefer the quality of 35mm film; some prefer the 10D. My sharpest images on 35mm film are sharper than my best 10D images, but the overall image quality isn't necessarily better-- film grain takes a toll. The 10D seems to produce more consistently sharp images, perhaps because film is subject to more variables: flatness, development imperfections, scanner focus, etc.
Although images 1A and 3A (above)
are most suitable for visual comparison, we use less manipulated images
1and
2
with additional sharpening (2A and 1B, below).
| Image 1 (above). EOS 10D, 70-200 f/4
L, 70 mm at f/8, ISO 100, taken in RAW format and converted with default
settings (normal sharpening). Even though the chart is printed to 100 lp/mm,
the analysis was limited to 80 lp/mm because there is little response above
60 lp/mm.
The 50% MTF frequency, which is closely related to perceived image sharpness, is about 30 lp/mm or 900 lw/ph. The 10% MTF frequency, which is closely related to traditional resolution measurements, is about 55 lp/mm or 1650 lw/ph. The Spatial frequency response (MTF) plot (the lower plot) has a linear frequency scale because my version of Matlab doesn't display grid lines properly in logarithmic plots. This worked out OK because, to my surprise, the falloff of MTF is nearly linear. The little bumps in the MTF curve are not significant: they are caused by sampling errors, grain (noise), and target imperfections. This result can be compared to the 24-85 mm f/3.5-4.5 lens at 48 mm, f/11 in the page on Lens testing. It had a 50% MTF frequency of about 22 lp/mm or 700 lw/ph and a 10% MTF frequency of about 49 lp/mm or 1500 lw/ph-- definitely inferior to the 70-200 f/4 L. Subjectively I rate the 24-85 as "pretty good;" the 70-200 f/4 L is superb. |
 |
| Image 2 (above). Provia 100F, 70-200
f/4 L, 70 mm at f/8, scanned at 4000 dpi, taken at the same distance
as 1. No additional sharpening.
The 50% MTF frequency is about 22 lp/mm or 1050 lw/ph. The 10% MTF frequency, is about 45 lp/mm or 2150 lw/ph. In terms of total image sharpness-- closely related to the line widths per picture height at 50% MTF, Provia is ahead by a factor of 1050/900 = 1.17, or 17%. But this comparison isn't quite fair because I perform additional sharpening on both the film and digital images in my normal workflow. I sharpen 4000 dpi scanned film images more than EOS 10D images because they need more. Provia image 2 is obviously softer than EOS 10D image 1 , which was strongly sharpened during the RAW conversion using the default setting (I'd guess the sharpening radius was about 2 pixels). Too much sharpening results in oversharpening-- exaggerated halos near edges. Severe oversharpening can appear as a peak in the SFR curve-- clearly not present here. Sharpening also increases grain and noise. The sharpened digital and film images are shown below. |
 |
| 1B. EOS 10D, Image 1 with a modest amount of additional Unsharp Mask (60%, Radius = 1, Threshold = 0 in Picture Window Pro); typical of what I apply in practice. |  |
| 2A. Provia 100F, Image 2 with additional Unsharp Mask (100%, Radius = 1, Threshold = 4 in Picture Window Pro); typical of what I apply in practice. More sharpening is applied to film than to digital images (1B, above). The heavy sharpening makes the grain extremely obvious. | 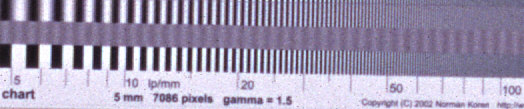 |
| The sharpened Provia 100F film image (2A) doesn't look quite
as sharp as the sharpened EOS 10D digital image (1B), but it's 1.59x
larger.
The analysis for the Provia 100F film image is shown on the right. As we explained in Understanding image sharpness part 2: Scanners sharpening, sharpening (Unsharp Masking) boosts response at middle spatial frequencies-- above 10 lp/mm in this case. For Provia 100F, the 50% MTF frequency is about 29 lp/mm or 1400 lw/ph (about 32% higher than the unsharpened image). The 10% MTF frequency, is about 54 lp/mm or 2600 lw/ph. For the EOS 10D, the 50% MTF frequency is about 43 lp/mm or 1300 lw/ph (about 43% higher than the unsharpened image). The 10% MTF frequency, is about 56 lp/mm or 1700 lw/ph. Sharpening makes a huge difference in 50% MTF frequencies, but the advantage of Provia at the 50% MTF frequency doesn't change much: it is now 1400/1300 = 1.08, or 8%. The 50% MTF numbers for both film and digital are about 30% below the numbers in Digital cameras vs. film, but the comparison between them is quite close. That's the real world. C'est la vie. |
 |
The precise comparison between the EOS 10D and 35mm film is highly dependent on the amount of sharpening. And you can't escape sharpening-- it's built in to most digital imaging devices including the EOS 10D and the Canoscan FS4000US. You need it to get the best image quality. I'd estimate that the sharpness advantage of the film image is around 10-20%, and I won't try to pin it down any closer. It's quicksand. Image quality involves more than sharpness. When you look at real images and observe the grain and color quality, the 10D is competitive with the best 35mm film.
Bottom line: I have no regrets about getting the 10D. I wish I could afford the 1Ds..
 We
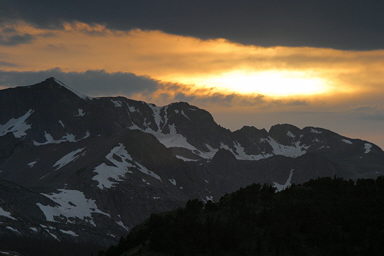
begin with an extreme example that illustrates the problem. I was standing
on a mountaintop near Caribou, Colorado, an old mining camp near Nederland
(a high town in Colorado, not to be confused with a low country in Europe).
The sun was setting and everything was set up perfectly, with a Cokin neutral
density filter to darken the sky. The EOS 10D with the 70-200 f/4 L zoom
was mounted on a sturdy tripod. The 10D was set for aperture priority at
f/9.5. Exposure compensation was -2 f-stops.
We
begin with an extreme example that illustrates the problem. I was standing
on a mountaintop near Caribou, Colorado, an old mining camp near Nederland
(a high town in Colorado, not to be confused with a low country in Europe).
The sun was setting and everything was set up perfectly, with a Cokin neutral
density filter to darken the sky. The EOS 10D with the 70-200 f/4 L zoom
was mounted on a sturdy tripod. The 10D was set for aperture priority at
f/9.5. Exposure compensation was -2 f-stops.
Suddenly the disk of the sun became plainly visible in the viewfinder-- very dramatic because the focal length was set to 200mm, equivalent to 320 mm in full-frame 35mm. But the highlights were burned out and the disk was invisible, even at -2 f-stops exposure compensation. I switched to manual exposure, exposed for 3 f-stops below nominal, but still no disk. Then it was gone. I could have gotten it on negative film, but not slide film. Fuji is introducing a technology for expanding dynamic range in it's long-delayed F700 digital camera. IMS Vision is working on a technology called HDRC; a product is probably a long way off.
Solutions: I'm a little more experienced now. I would have set Exposure Mode to manual (M) before the sun popped out. That would have simplified making two exposures-- one for the sun (the hot spot) and one for the rest of the image. I can easily combine them using the Stack images transform in Picture Window Pro 3.5. Digital SLRs have a "hidden" dynamic range that you can access using techniques described in Tonal quality and dynamic range in digital cameras. Briefly, keep the ISO speed low (100 or 200), store images in RAW format, expose to preserve highlight detail, then convert images using a program with a curves feature, like Capture One DSLR LE.
The new Imatest program allows digital camera tonal response and dynamic range can be measured easily and accurately using a transmission step wedge-- a piece of film with zones of incresing density. The details of the measurement are in the Imatest Q-13 instructions.
Here are the results for the Canon EOS-10D at ISO 400, converted from RAW format with Capture One LE. The plot on the left uses a linear scale to display Pixel level / 255 for the individual steps. It is difficult to distinguish the darker levels. The plot on the right, which uses log scales, is the counterpart of film characteristic curves, above. It is more useful.
| The total dynamic range of the EOS-10D is 8.5 f-stops. Dynamic range
improves slightly for 48-bit TIFF conversion
and ISO 100. Noise in dark regions is significantly lower for 48-bit TIFF conversion. The
shape of the response curve is a strong function of the conversion software
settings. The curve on the right is for Canon Zoom Browser with Contrast
set to Low; it is very different from Capture One LE (though both are half
an "S" curve), but the dynamic range hardly changes.
More material on dynamic range can be found in the Imatest Q-13 Stepchart Tour. You can download an evaluation version of Imatest that allows up to 20 runs of individual modules, and you can purchase Imatest for a very affordable price. |
 |
Part 1 | Introduction | News | The EOS-20D | Links | Why I chose the 10D | Lenses | Accessories
Part 2 | Read the manual! | Menu | Operating modes | Settings | Tips
Part 3 | Image quality/file formats | Nikon D100 comparison | RAW conversion | Flash
Part 4 | Resolution compared to 35mm | Dynamic range and tonal response | Summary
Related pages: Digital cameras | Digital vs. film | Tonal quality and dynamic range in digital cameras

| Images and text copyright (C) 2000-2013 by Norman Koren. Norman Koren lives in Boulder, Colorado, where he worked in developing magnetic recording technology for high capacity data storage systems until 2001. Since 2003 most of his time has been devoted to the development of Imatest. He has been involved with photography since 1964. |  |